Monte Carlo Method
Given a relatively small sample size of data, it was necessary to find a way to extrapolate potential trends without having the necessary data to actually visualize them. A work around for this is to use the Monte Carlo method of computation, which randomly selects values from a probability distribution. The values of all three parameters, the mass of the first black hole, the mass of the second black hole, and the separation between the two were all randomly generated from available distributions of data. These random selections were then run in 5000 simulations to obtain the probability distributions.
Mass Distribution
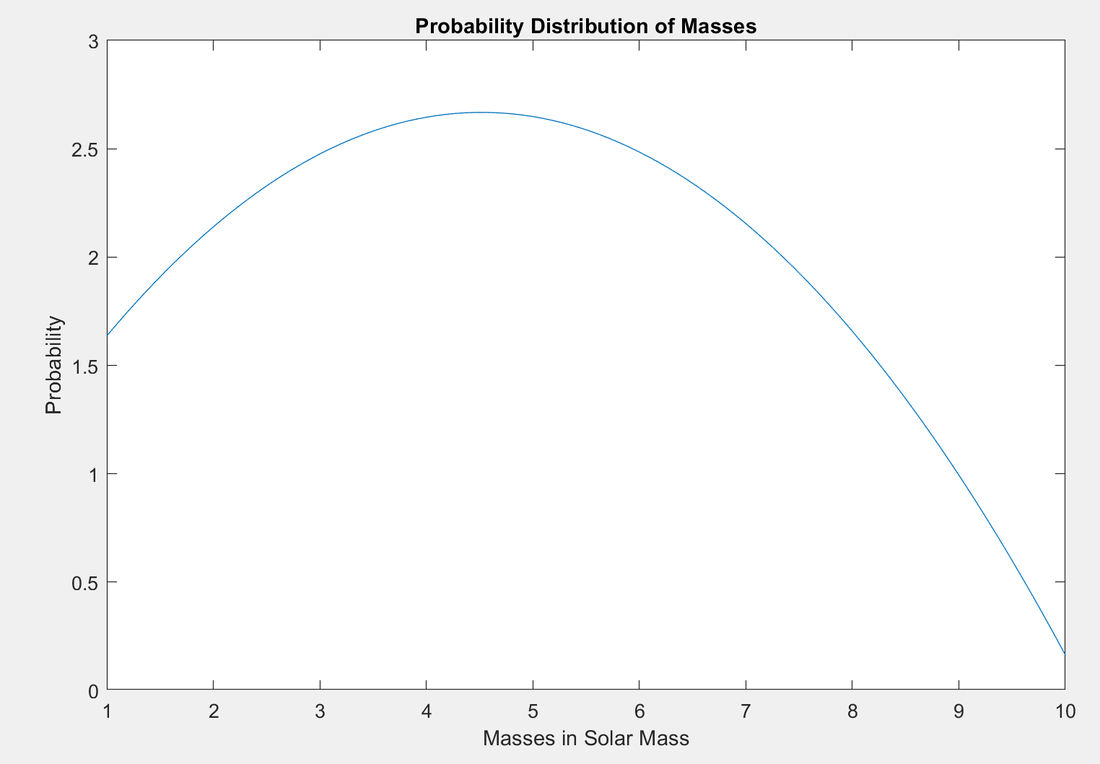
Since very little is known about systems where two black holes orbit each other, the mass distributions were sampled from data consisting of one binary black hole and one star. The data consisted of the mass function of the black hole, or the absolute minimum mass the black hole could have for the system to still exist. To enhance these minimums, the data is scaled by a random factor to include masses that could possibly exist in these systems and to add variation to the data. Below is a plot of the distributions of masses originally sampled from the observational data and how often they appear. Source 1.
Radius Distribution
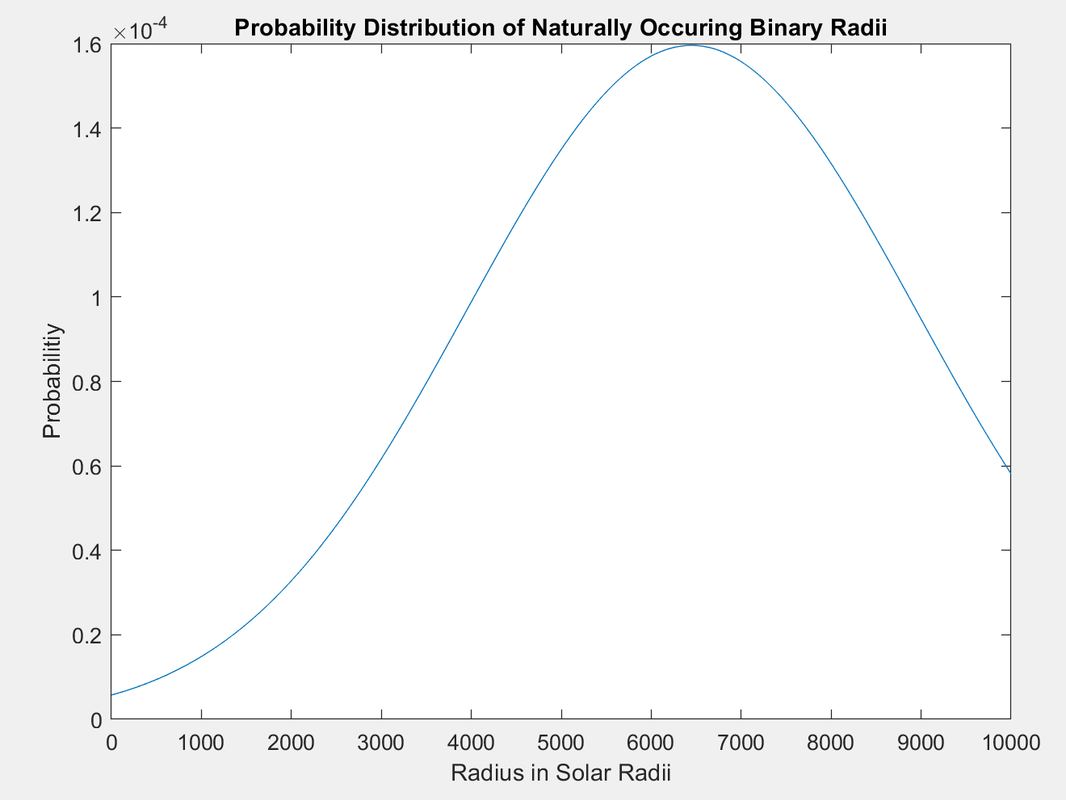
In order to sample different radii, a distribution of radii was used that mimics naturally occurring binary systems. The shape of said distribution is a Gaussian centered at 30 astronomical units, or 6447 Solar radii. Below is the radius distribution used for sampling.
Source 1: •Ozel F., & Psaltis, D., & Narayan, R., & McClintock, J. E. (2010). The Black Holes Mass Distribution in the Galaxy. The Astrophysical Journal, 725. 1920.
